You are viewing documentation for Kubernetes version: v1.22
Kubernetes v1.22 documentation is no longer actively maintained. The version you are currently viewing is a static snapshot. For up-to-date documentation, see the latest version.
Alpha in Kubernetes v1.22: API Server Tracing
Authors: David Ashpole (Google)
In distributed systems, it can be hard to figure out where problems are. You grep through one component's logs just to discover that the source of your problem is in another component. You search there only to discover that you need to enable debug logs to figure out what really went wrong... And it goes on. The more complex the path your request takes, the harder it is to answer questions about where it went. I've personally spent many hours doing this dance with a variety of Kubernetes components. Distributed tracing is a tool which is designed to help in these situations, and the Kubernetes API Server is, perhaps, the most important Kubernetes component to be able to debug. At Kubernetes' Sig Instrumentation, our mission is to make it easier to understand what's going on in your cluster, and we are happy to announce that distributed tracing in the Kubernetes API Server reached alpha in 1.22.
What is Tracing?
Distributed tracing links together a bunch of super-detailed information from multiple different sources, and structures that telemetry into a single tree for that request. Unlike logging, which limits the quantity of data ingested by using log levels, tracing collects all of the details and uses sampling to collect only a small percentage of requests. This means that once you have a trace which demonstrates an issue, you should have all the information you need to root-cause the problem--no grepping for object UID required! My favorite aspect, though, is how useful the visualizations of traces are. Even if you don't understand the inner workings of the API Server, or don't have a clue what an etcd "Transaction" is, I'd wager you (yes, you!) could tell me roughly what the order of events was, and which components were involved in the request. If some step takes a long time, it is easy to tell where the problem is.
Why OpenTelemetry?
It's important that Kubernetes works well for everyone, regardless of who manages your infrastructure, or which vendors you choose to integrate with. That is particularly true for Kubernetes' integrations with telemetry solutions. OpenTelemetry, being a CNCF project, shares these core values, and is creating exactly what we need in Kubernetes: A set of open standards for Tracing client library APIs and a standard trace format. By using OpenTelemetry, we can ensure users have the freedom to choose their backend, and ensure vendors have a level playing field. The timing couldn't be better: the OpenTelemetry golang API and SDK are very close to their 1.0 release, and will soon offer backwards-compatibility for these open standards.
Why instrument the API Server?
The Kubernetes API Server is a great candidate for tracing for a few reasons:
- It follows the standard "RPC" model (serve a request by making requests to downstream components), which makes it easy to instrument.
- Users are latency-sensitive: If a request takes more than 10 seconds to complete, many clients will time-out.
- It has a complex service topology: A single request could require consulting a dozen webhooks, or involve multiple requests to etcd.
Trying out APIServer Tracing with a webhook
Enabling API Server Tracing
-
Enable the APIServerTracing feature-gate.
-
Set our configuration for tracing by pointing the
--tracing-config-fileflag on the kube-apiserver at our config file, which contains:
apiVersion: apiserver.config.k8s.io/v1alpha1
kind: TracingConfiguration
# 1% sampling rate
samplingRatePerMillion: 10000
Enabling Etcd Tracing
Add --experimental-enable-distributed-tracing, --experimental-distributed-tracing-address=0.0.0.0:4317, --experimental-distributed-tracing-service-name=etcd flags to etcd to enable tracing. Note that this traces every request, so it will probably generate a lot of traces if you enable it.
Example Trace: List Nodes
I could've used any trace backend, but decided to use Jaeger, since it is one of the most popular open-source tracing projects. I deployed the Jaeger All-in-one container in my cluster, deployed the OpenTelemetry collector on my control-plane node (example), and captured traces like this one:

The teal lines are from the API Server, and includes it serving a request to /api/v1/nodes, and issuing a grpc Range RPC to ETCD. The yellow-ish line is from ETCD handling the Range RPC.
Example Trace: Create Pod with Mutating Webhook
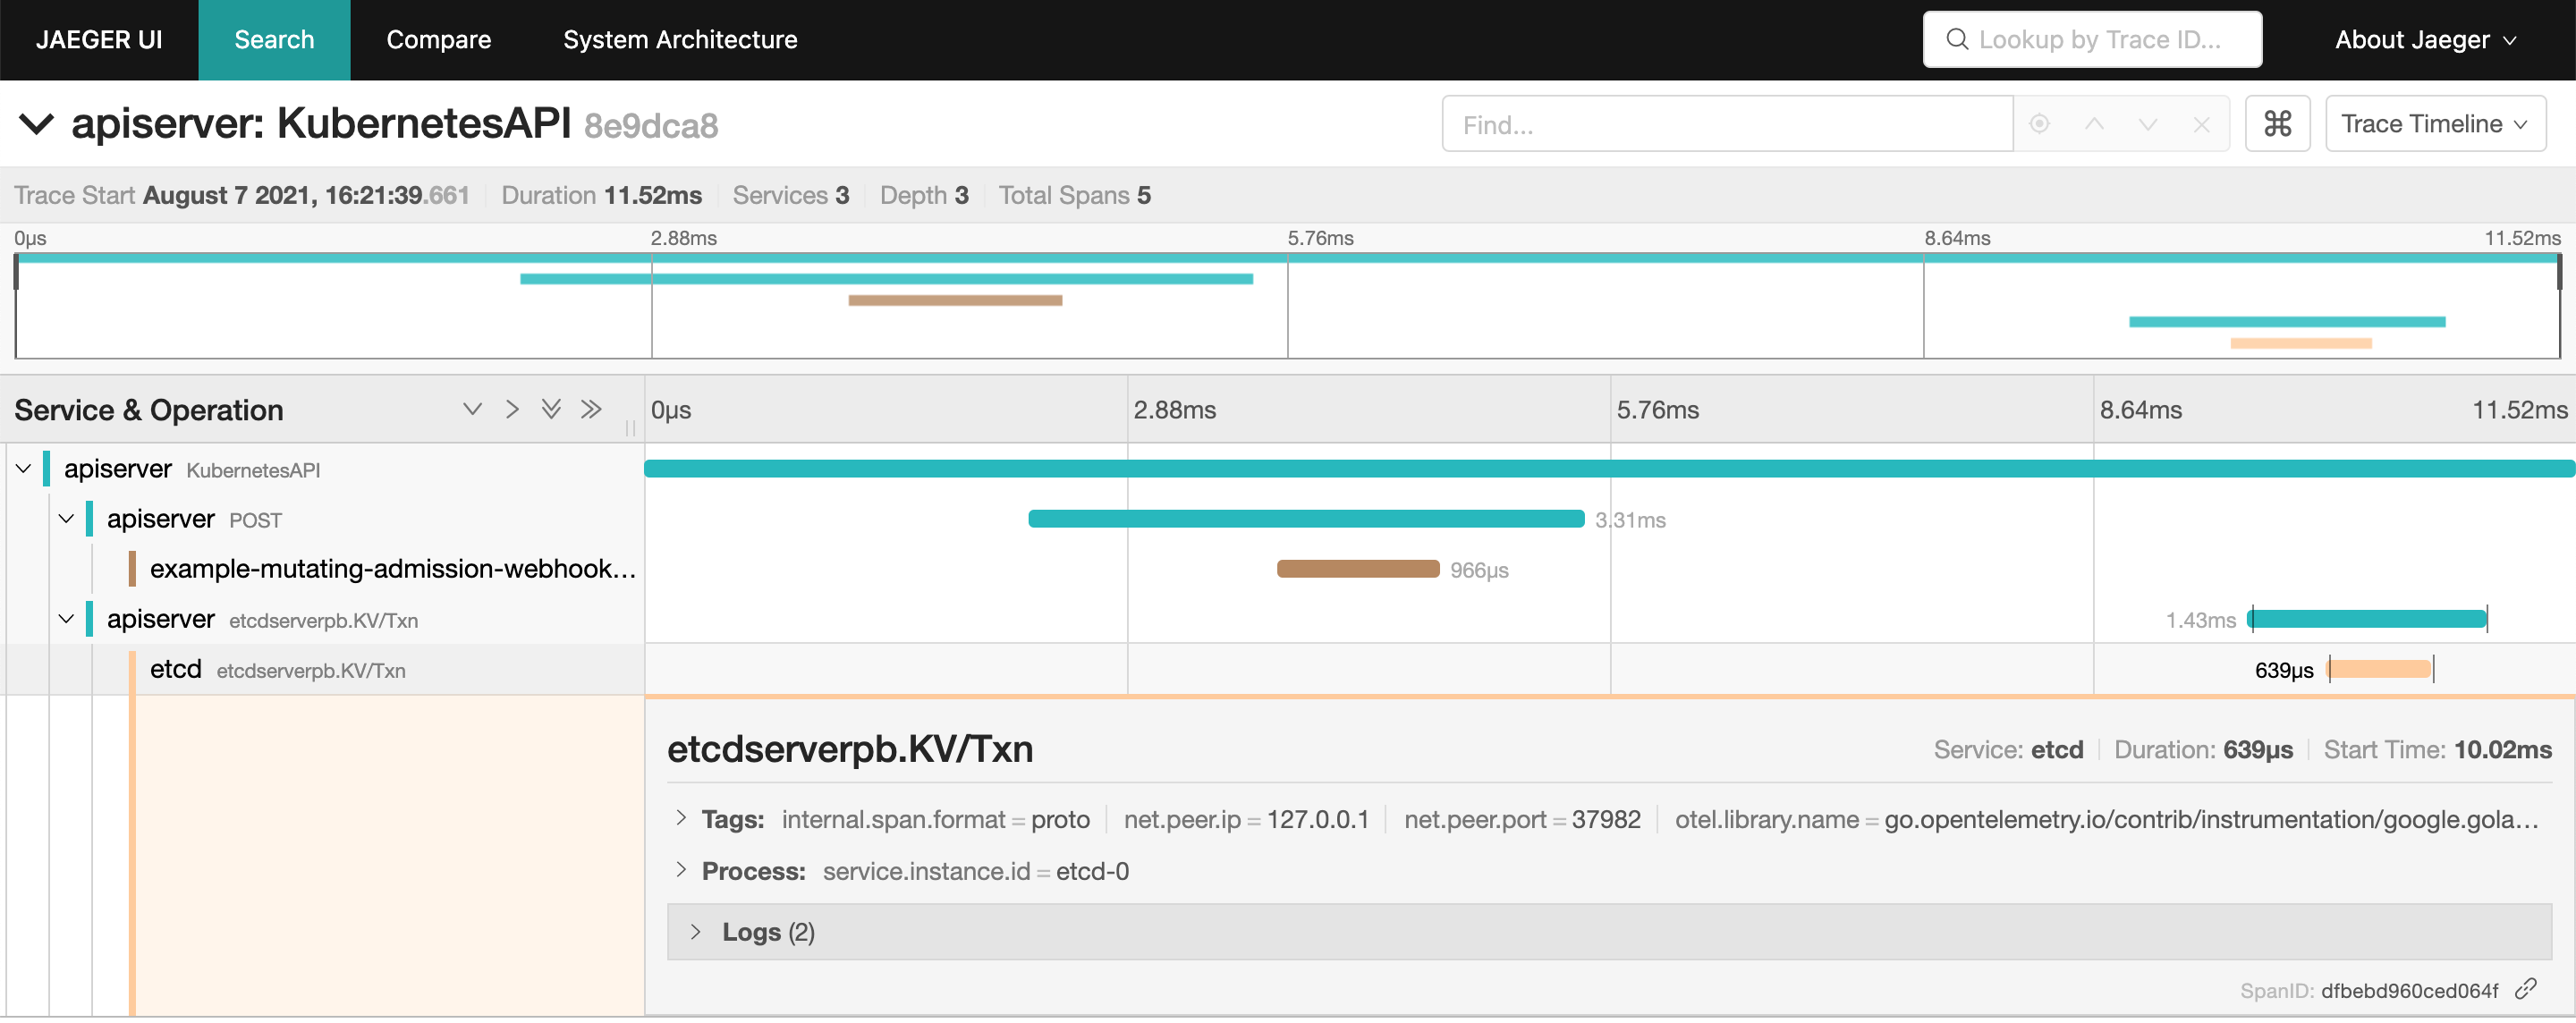
I instrumented the example webhook with OpenTelemetry (I had to patch controller-runtime, but it makes a neat demo), and routed traces to Jaeger as well. I collected traces like this one:

Compared with the previous trace, there are two new spans: A teal span from the API Server making a request to the admission webhook, and a brown span from the admission webhook serving the request. Even if you didn't instrument your webhook, you would still get the span from the API Server making the request to the webhook.
Get involved!
As this is our first attempt at adding distributed tracing to a Kubernetes component, there is probably a lot we can improve! If my struggles resonated with you, or if you just want to try out the latest Kubernetes has to offer, please give the feature a try and open issues with any problem you encountered and ways you think the feature could be improved.
This is just the very beginning of what we can do with distributed tracing in Kubernetes. If there are other components you think would benefit from distributed tracing, or want to help bring API Server Tracing to GA, join sig-instrumentation at our regular meetings and get involved!